Channel analytics
Proof your premieres and reposts grow the channel.
Revenue, engagement, reach and follower growth per booking - so you book more of what works.
Revenue
See what every channel earns, in one report.
A premiere on SoundCloud, a Story on Instagram, a video on YouTube and a post on TikTok all bill through the same booking as separate line items, and the revenue report sums those line items into one net figure, so you see what your channels earned together instead of adding up per-platform prices from a PayPal history.
Tracks
An engagement rate for every track you publish.
The tracks report ranks every upload by plays, likes, reposts and comments, and rolls them into one engagement rate so you can spot which bookings actually landed with your audience.
Network reach
Link performance spikes to big reposter profiles.
Network reach lists every reposter with their follower count and the reach gained from that repost, so you can see who is worth booking again instead of relying on a follower number alone.
Follower growth
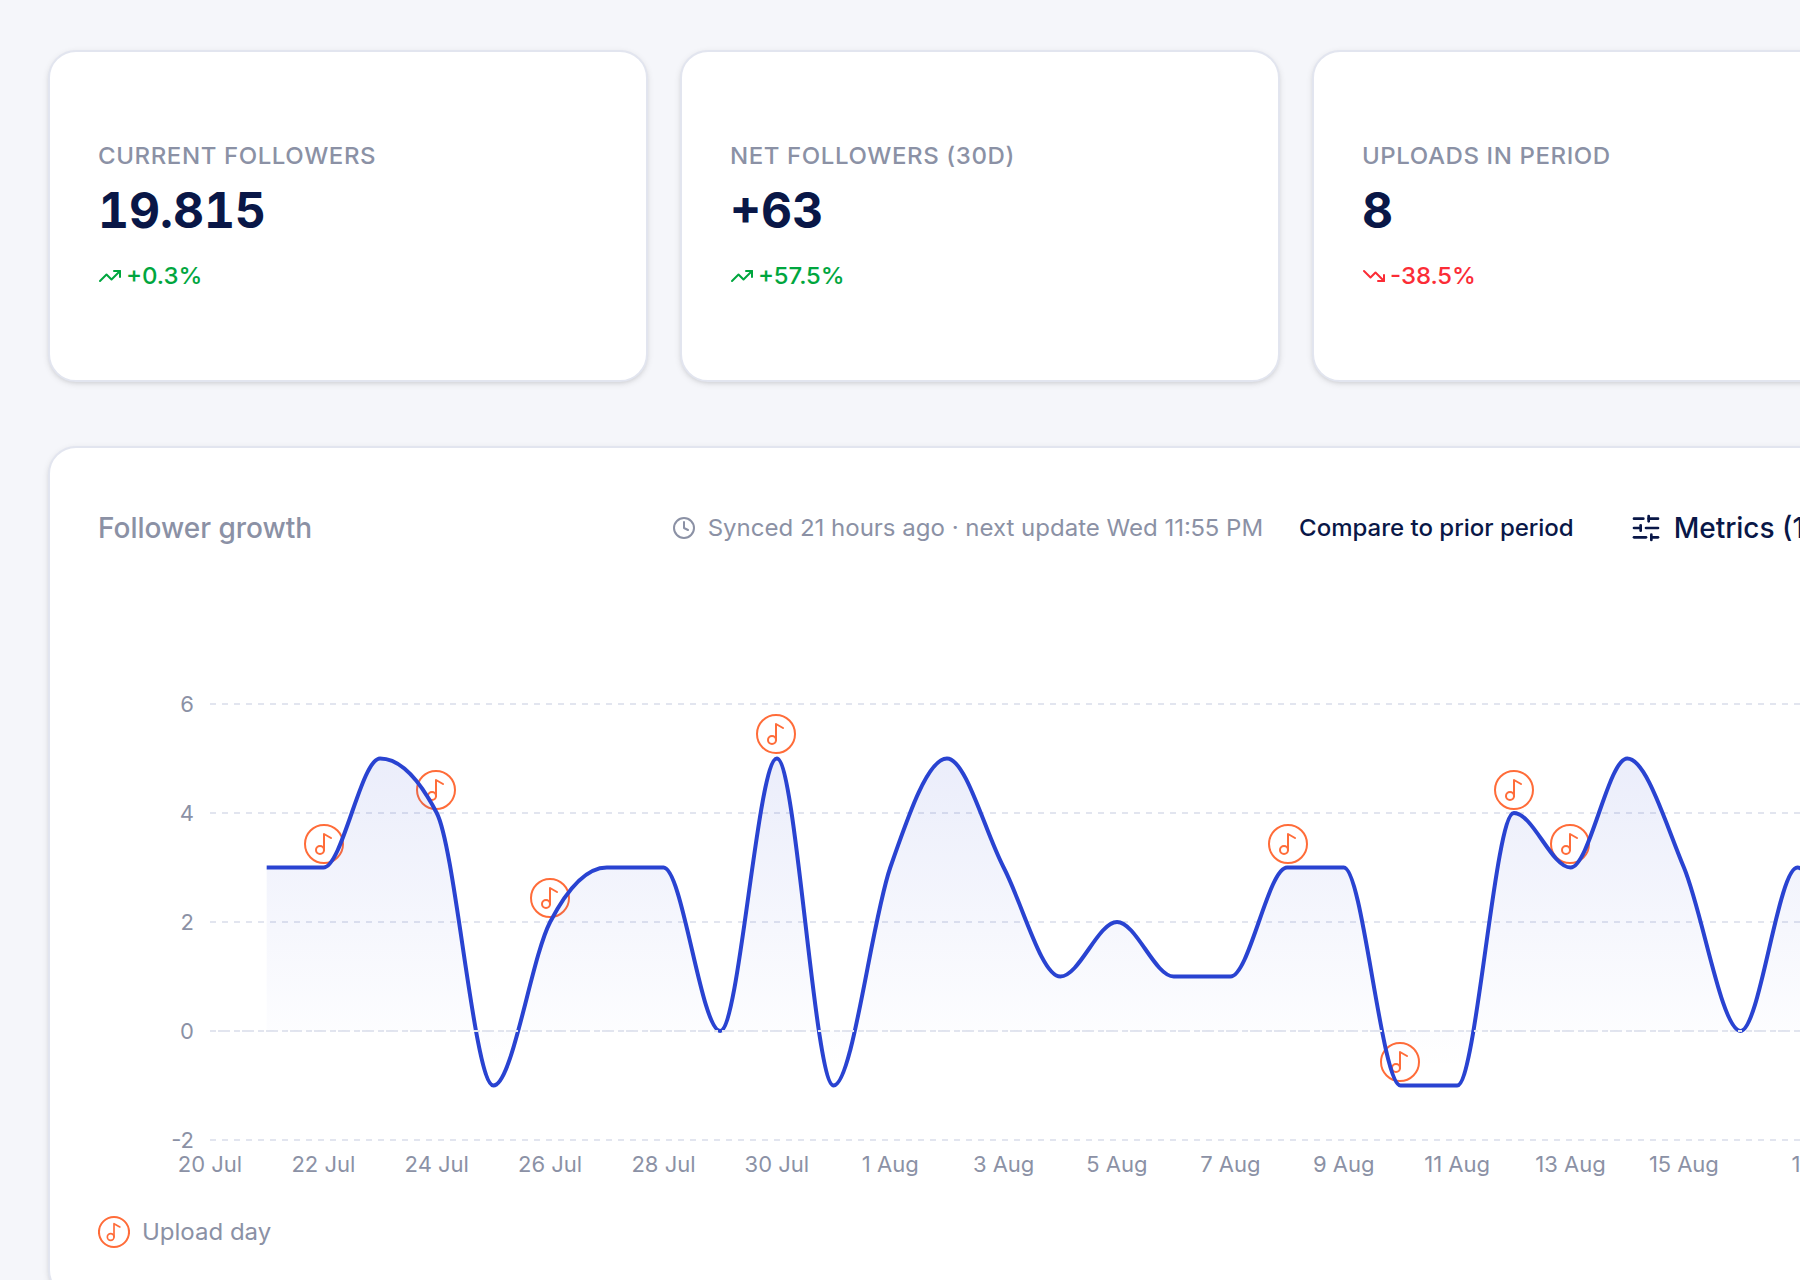
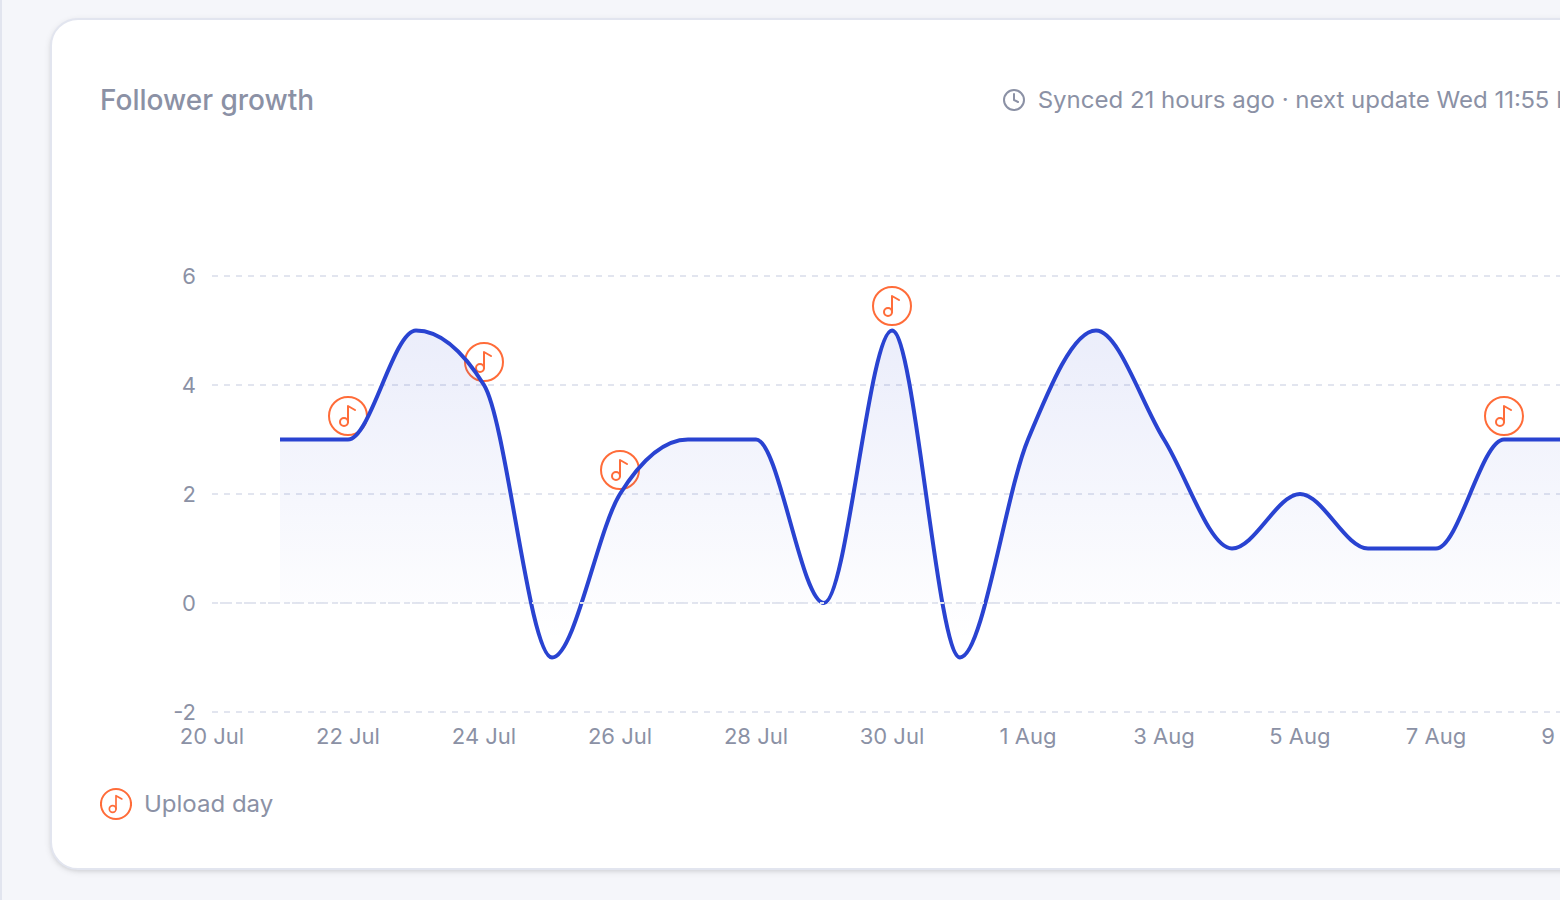
Follower growth tied back to the uploads that produced it.
Track the window gain since your last upload, the lift against your typical growth, and followers gained per 1K reach - three numbers that tell you whether a booking actually moved your follower count or just added plays.
Download gates
Funnel numbers for every gate you run.
The download gates report tracks total views, starts, completions and conversion rate per gate, so you can see exactly where fans drop off between clicking the link and unlocking the file.
Questions
What is free?
The followers view, over the last 30 days. Revenue, tracks, network reach, download gates and the other views are Pro, and the 14-day trial opens all of them.
Is the data live?
SoundCloud-sourced numbers refresh on a schedule rather than in real time, and the day charts only count finished days, so today never shows up as a half-day dip.
Does it cover all my channels?
Analytics reads your first connected SoundCloud channel today.
How exact is the per-upload attribution?
It is deliberately loose - gains landing more than 7 days after an upload are not attributed - so treat it as a signal for what to book more of, not as accounting.
Book more of what the numbers prove works.
Connect your channel and the followers view starts filling in.
View analytics